Welcome to the 3rd and final instalment of our Indoor Air Quality Monitoring (iAQM) discussion. Today we discuss a particular indoor air quality sensor we developed for a client – Grosvenor Engineering – who are leaders in analytics used in the maintenance of mechanical and HVAC equipment.
iAQM Sensor
We were engaged by Grosvenor Engineering to develop an indoor air quality sensor – the iAQM – for use in office buildings. The sensor detects a wide variety of air parameters including temperature, relative humidity, CO2, TVOCs, light, sound, people movement and particulate matter.
We used an off the shelf enclosure to reduce development costs. It has a very modern looking circular appearance and installation is quite simple. A single hidden screw fastens the iAQM to the wall and a power cable exits from the rear through the cavity wall and up into the roof space for connection to 12V-24V AC or DC power, commonly found in buildings.
There is also a desktop version – the same iAQM mounted on a stand – and connected to a 12V plugpack. This allows the product to be portable and relocatable within an office.
A typical office will have multiple iAQMs. The product is wireless and operates using the Zigbee protocol. This is a mesh network meaning each sensor is part of a chain. It allows data to hop from one iAQM to another, until it reaches the gateway. By allowing hopping, you can extend the network virtually as far as you want, with virtually no range limitations.
All data is AES encrypted, thus security is guaranteed for the entire data path.
Gateway
There is a Gateway connected to the cellular network which acts as the conduit between the sensors and the portal. The Gateway pulls all the data from each sensor and sends it to a portal, which has a dashboard, thus the customer can view the raw data and insights. One gateway will service up to 240 iAQMs.
Dashboard and Portal
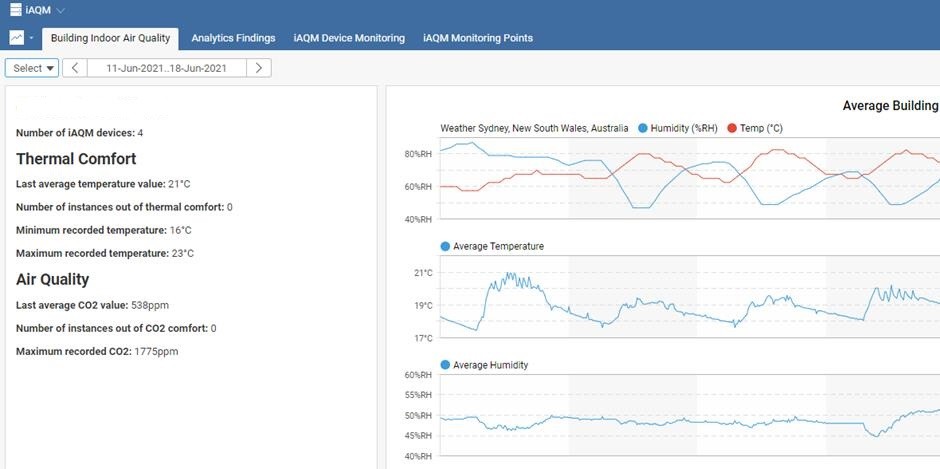
When the customer logs in they will land on a home page with a summary table of all iAQMs. They also see a detailed view of each iAQM with historical data starting from the live date. The dashboard provides insights such as bad air quality, bad building temperature, CO2 over the limit of acceptance, lights left on without occupants, air conditioning left on without occupants and many others. Whilst the raw historical data is handy, the insights of the air quality are what really makes the difference in driving business decisions to optimise air quality.
Customer customisation is also possible as Grosvenor have an in-house team of developers to tune the dashboard to the client’s exact requirements.
Below are screen shots of the home page and the insights page.

Final Comment
The iAQM system is specifically designed for commercial and industrial office spaces. All sensors are sourced from vendors who are “top of the tree” in terms of quality and reliability. Security is implemented throughout all parts of the data flow. The system is very robust and ideally suited to a commercial environment as the sensors can span across hundreds of metres on a floor and across multiple floors. The product is in production and has been rolled out to multiple sites across Australia.

