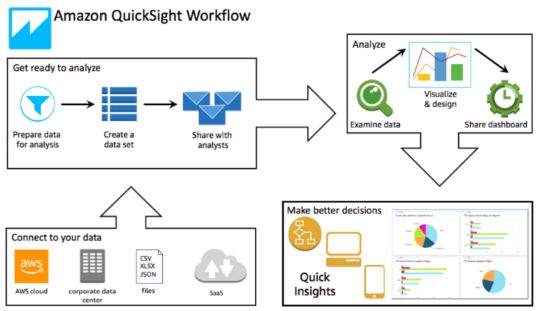
We recently had a requirement to visualise data posted to AWS. We decided the easiest and most effective way to do this was by using one of AWS visualisation tools — QuickSight. After embarking on a journey of discovery (and a bit of hair-pulling to figure out how best to implement the task), we settled on using a combination of AWS services to bring the visualisation to life. Here is how we did it.
The data is in MQTT format and entered the AWS platform via the IoT Core service. A database was needed to warehouse the data, so we used the S3 service for that purpose. This setup extracted the data from IoT Core and split it into JSON files stored in a folder. Each received packet was stored in its own file.
Another service, AWS Glue, was used to extract the JSON files and write them into a serverless database so they could be queried. Essentially this means the data is read and queried each time.
Finally, an SQL-based service called Athena was connected to AWS Glue, allowing QuickSight to run queries for the data that was required for the visualisations.
It wasn’t the easiest process, and there were many lessons learnt along the way, but we got it working well in the end. This included understanding permissions, roles, the data format at each endpoint as well as resolving issues with MQTT packets which caused issues for Athena.
QuickSight supports multiple logins with different permission levels. You can set up multiple tabs, and a variety of visualisation tools are available, including charts, tables, bar graphs, and more. It also offers alarms and rules to process the data and implement business logic, although we didn’t use that feature. It’s quite well featured and once you get over the hurdles of setting up the above mentioned services, you can build a dashboard in a few hours or so.
If you’re comfortable using SQL and Excel-style formulas—as most of us are—it’s a very versatile tool. The cost is minimal (less than A$10 per month for a single user). The tools are all web-based and all you need is an account to get started. If you don’t require support, you can use the free support plan, as we did.
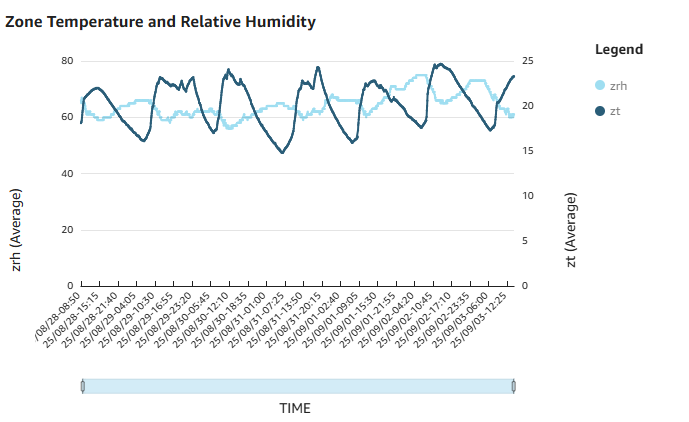
Below is a a chart to display the temperature and relative humidity in a room, which is one of the charts we created.